.png)
HIMS - our best trades of the year with hefty returns, and more to come.
- Strats Team

- Jun 15, 2025
- 6 min read
In this brief, we will examine the stock of Hims & Hers Health, Inc., and review how our trade perspectives have performed year-to-date.
We will review all our recent trades, including their entries, exits, and, most importantly, the reasoning behind our trade strategies that have yielded significant returns. This brief provides a comprehensive overview of the stock, including its fundamentals, technicals, and various trades we executed, along with their payoff profiles.
Most importantly, we will examine new trade perspectives to take tomorrow after the market opens, as the stock presents an excellent opportunity for going long, with an estimated time to profit realization ranging from a couple of weeks to a month.
Briefing Date: June 15, 2025
Market Focus: Equities & Options (US)
Time Horizon: NA
Distribution Time: Post-Market
Overview
Hims & Hers Health, Inc. (HIMS) has established itself as a leading direct-to-consumer healthcare platform through a subscription-based revenue model. This model enables continuous, personalized care while generating predictable, recurring revenue. As of Q1 2025, Hims & Hers reported 2.4 million subscribers, a 38.4% increase from the previous year, with over 1.4 million utilizing personalized solutions. This growth resulted in $576.4 million in online revenue, a 115.3% year-over-year increase, accounting for nearly all of its total revenue of $586 million.
Technically, the stock has outperformed all the fundamental expectations by analysts and has been the best-performing stock, based on year-to-date returns.
Chart
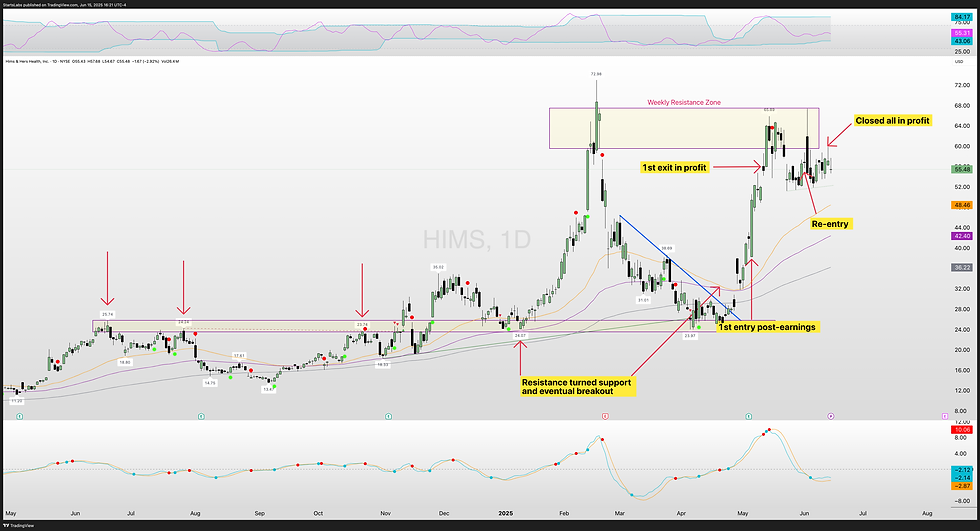
As shown in the chart on the left, we have multiple resistance points indicated by red arrows downward, with HIMS making multiple pivots last year. It eventually broke out at the beginning of 2025, and the resistance turned into support in the future, with a bottom formed after the Liberation Day tariffs at the beginning of April, before a 90-day pause was announced. It subsequently broke out of the wedge formation, as indicated by the "blue" downward slope.
1st Entry, May 06, 2025 (Times are to be translated from CET Europe to US Eastern)

Soon after the quarterly earnings, we made our first entry at the market open, on a stronger-than-expected earnings result, coupled with a strong technical wedge pattern breakout, as shown in the chart. This is a very high-probability trade, as all of our checklists were marked for entry.
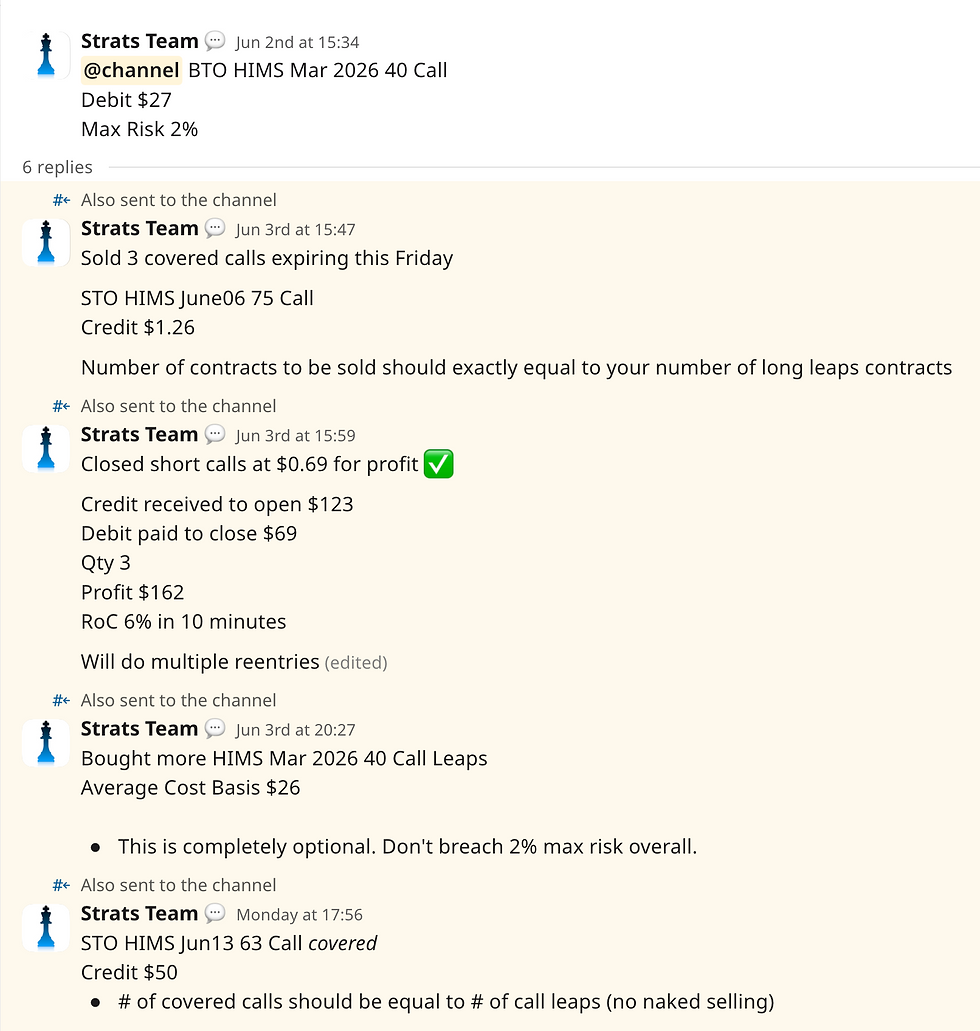
BTO (buy to open) HIMS Jan2027 30 Call for a $21 debit ($2100 per contract)
HIMS was trading at roughly $40 a share when we made our entry for call option leaps expiring in January 2027. Longer expiration dates are preferable, which in this case has virtually zero theta decay (time decay), but are very sensitive to volatility (vega), which is beneficial for us as an option buyer to have wider swings for small movements in the underlying stock, hence we have chosen LEAPS (long-term equity anticipation securities) options.
We closed the position as the stock surged to north of $55 per share on May 12, 2025, for a profit of $4200, a return of 67% in 6 days. The absolute profit figure is less important, but the return on capital is our primary focus, as we don't disclose the number of contracts at the time of entry in the alert, which can lead to our members mistakenly interpreting it as a green signal to purchase the exact number of contracts. This is detrimental for small accounts, given the risk and size of the trade, which could deviate from our maximum risk mandate of 2%. Therefore, we only label them as "Max Risk 2%." Returns however, can be replicated, as they depend on the entry and exit prices, irrespective of the quantities traded.
Multiple re-entries / exits, June 02, 2025 to June 12, 2025
After a brief retracement, we deployed what the industry calls a "Synthetic Covered Call", a diagonal spread, which involves holding a deep in-the-money call option LEAPS, often at or above 80 delta, and selling out-of-the-money call options on shorter dated expiration, often below 30 DTE (days-to-expiration).
This is similar to holding cash and selling OTM calls expiring in a few days, which will have higher theta (time decay).
This is a powerful institutional trading strategy designed to earn a monthly income from selling covered calls, while also generating alpha from the rising underlying stock. Since the deep-in-the-money (ITM) call option LEAPS appreciate significantly, they behave like a stack of 100 shares per contract held.
Exits in profits

Payoff Profile of Synthetic Covered Calls

Synthetic Covered Call Strategy Overview: (general; not related to HIMS)
Trade Construction:
Long Call: Buy a call option with a lower strike price and a longer expiration (e.g., 6–12 months out).
Short Call: Sell a call option with a higher strike price and a shorter expiration (e.g., 1 month out).
Objective: Generate income from short call premiums while maintaining upside potential from the long call, with lower capital compared to owning 100 shares.
Risk/Reward:
Max Loss: Limited to the net debit paid (long call premium minus short call premium), minus any intrinsic value of the long call if the stock price falls.
Max Gain: Capped when the stock price exceeds the short call strike, as short call losses offset long call gains.
Breakeven: Typically between the long and short call strikes, adjusted by the net premium.
Hypothetical Example
Stock: XYZ, trading at $50 per share.
Long Call: Buy 1 XYZ Jan 2026 $45 call (6 months out) for $7.00 ($700 per contract).
Short Call: Sell 1 XYZ Feb 2025 $55 call (1 month out) for $1.50 ($150 per contract).
Net Cost: $700 − $150 = $550 ($5.50 per share).
Assumptions:
We evaluate the payoff at the short call’s expiration (Feb 2025).
The long call’s value at Feb 2025 is approximated as its intrinsic value plus some extrinsic value.
No early assignment or rolling of the short call.
Only deployed on bullish stocks as explained in the below precautions.
Let's examine the payoff profile. The green zone is our expectation, and the red is the adverse outcome.

Precautions to consider for Synthetic Covered Calls
Use this strategy only in bullish stocks that are expected to appreciate over the long term.
Never deploy this if a stock has upcoming dividends or earnings events.
The more volatile the stock, the better, but caution must be exercised, and a strong technical conviction based on support and resistance levels is required.
Never sell naked calls, so for every leap contract held, sell the same or fewer number of calls.
If the stock depreciates, continue selling the calls and earn income; however, the stock should ideally appreciate in the long term, provided you have done the analysis correctly before entering the position.
If the stock continues to depreciate significantly due to poor sentiment, consider closing the position at a loss and selling out-of-the-money (OTM) credit spreads or buying puts to recover some profit; this would be an ideal hedging strategy.
It all boils down to ONE THING: NEVER DEVIATE FROM MAX RISK 2% of the account.
New Opportunity
As of this writing on June 15, 2025, we intend to enter into the HIMS call option LEAPS tomorrow at the market open, driven by several strong technical factors. To put it briefly, the stock appears to be showing signs of a breakout to the upside, potentially reaching $85 or higher before the following earnings report in August. Here is the chart for your reference. We have a strong breakout pattern formation that could be breached to the upside going into its next quarterly earnings in August. This is supported by a tightened Bollinger band width, coupled with MACD confidence and RSI signalling upward price movements in the coming days. HIMS could spend some time within the triangle shown before breaking out to the upside. We will wait for the initial market reaction to the Middle East tensions between Israel and Iran, and evaluate cheaper call option LEAPS by examining the volatility (IV) surface. We intend to hold this stock for a long exposure to the upside and expect to close it with triple-digit returns, just as we did the last time discussed above.

Conclusion
We hope you find our analysis helpful, and if you have any questions, please feel free to post them in the comment section. We look forward to discussing your viewpoints and addressing any clarifications you may have.
Options Disclaimer
This material is purely written for educational purposes only, and no content of the Strats Labs publications, be it trading briefs, trade alerts, or market updates sent in the Slack workspace or on the website, is to be construed as financial advice. All deliverables of Strats Labs are strictly for educational purposes only. Investing in derivatives carries leveraged risk, and options trading is not suitable for all investors. You may lose all of your capital invested. Please conduct thorough research and due diligence before considering any investment, or consult a registered financial advisor. If you need to understand the risks of trading options, please read this disclosure from Options Clearing Corporation: https://www.theocc.com/company-information/documents-and-archives/options-disclosure-document The link is provided as a courtesy.


Comments